Who shot the Dodo?

By Scott Billings, Digital Engagement Officer

If ever the Oxford Dodo were to have squawked, its final squawk may have been the saddest and loudest. For the first time, the manner of death of the museum’s iconic specimen has been revealed: a shot to the back of the head.

This unexpected twist in the long tale of the Oxford Dodo has come to light thanks to a collaboration between the Museum and the University of Warwick. WMG, a cutting-edge manufacturing and technology research unit at Warwick, employed its forensic scanning techniques and expertise to discover that the Dodo was shot in the neck and back of the head with a 17th-century shotgun.

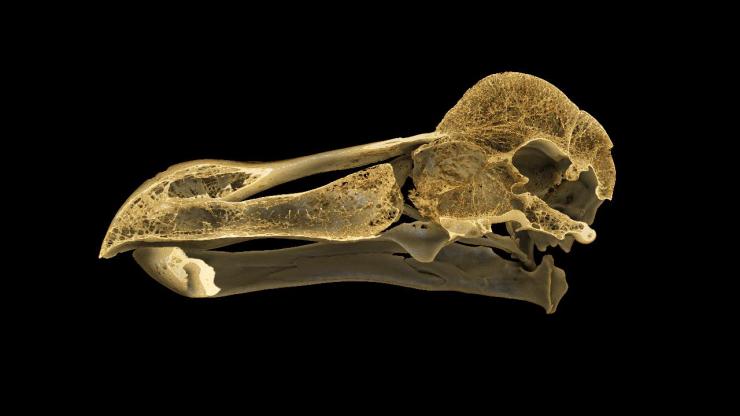
Mysterious particles were found in the specimen during scans carried out to analyse its anatomy. Further investigation of the material and size of these particles revealed them to be lead shot pellets of a type used to hunt wildfowl during the 1600s.

The Oxford Dodo specimen, as it has come to be known, originally came to the University of Oxford as part of the Tradescant Collection of specimens and artefacts compiled by father and son John Tradescant in London in the 17th century. It was thought to have been the remains of a bird recorded as being kept alive in a 17th-century London townhouse, but the discovery of the shotgun pellets cast doubt on this idea, leaving the bird’s origins more mysterious than ever.

Dodos were endemic to the island of Mauritius in the Indian Ocean. The first European accounts of the bird were made by Dutch explorers in 1601, after they rediscovered the island in 1598. The last living bird was sighted in 1662.
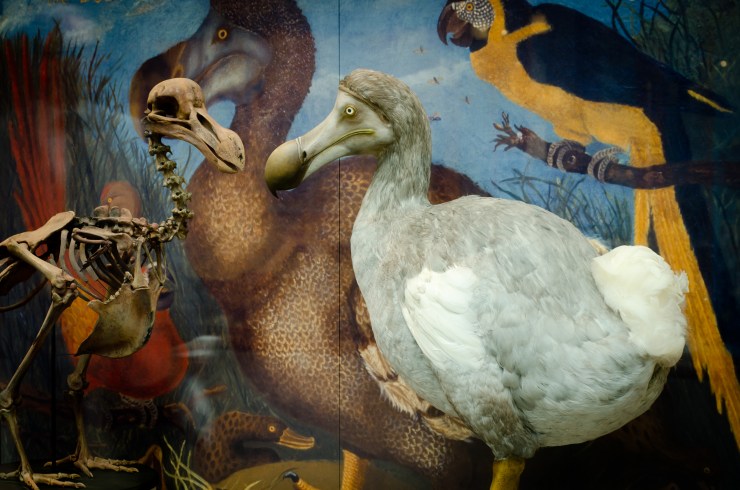
The story of the Oxford Dodo is especially significant because it represents the most complete remains of a dodo collected as a living bird – the head and a foot – and the only surviving soft tissue anywhere in the world.

This discovery reveals important new information about the history of the Oxford Dodo, which is an important specimen for biology, and through its connections with Lewis Carroll and Alice’s Adventures in Wonderland of great cultural significance too.
– Professor Paul Smith, Museum director
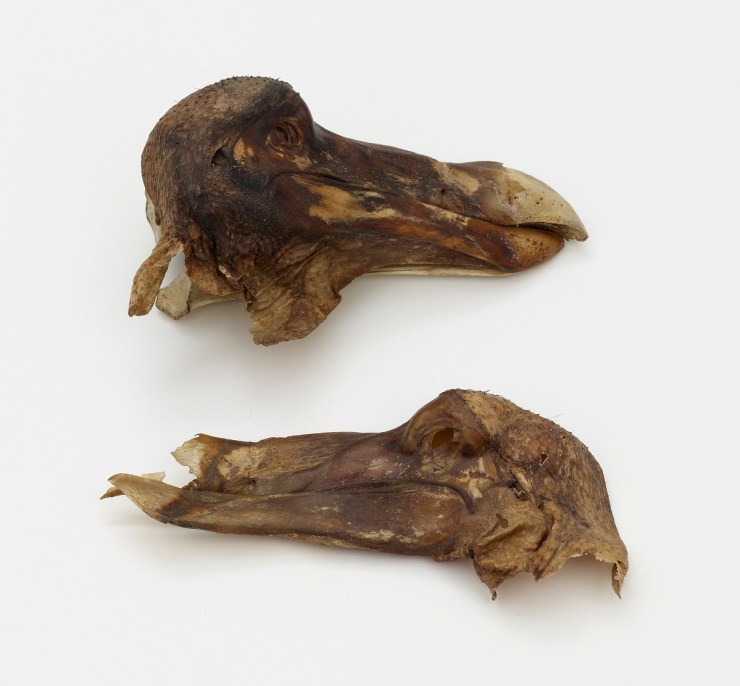
The Oxford Dodo represents the only soft tissue remains of dodo in the world. This iconic specimen was taken from the Museum to WMG at the University of Warwick for CT scanning.

WMG’s CT scans show that this famous symbol of human-caused extinction was shot in the back of the head and the neck, and that the shot did not penetrate its skull – which is now revealed to be very thick.

The discovery of such a brutal demise was quite a surprise as the scans were actually focused on discovering more about the Dodo’s anatomy, as well as how it lived and died. This work will continue, but we now have a new mystery to solve: Who shot the Dodo?

What’s the next step? It is possible that the isotope of lead in the shot could be analysed and traced to a particular ore field. This might tell us what country it was mined in, and perhaps what country is was made in, and ultimately reveal who shot the Dodo.

A genetic map of Britain

Our Settlers exhibition tells the story of the peopling of Britain, from the arrival of the earliest modern humans over 40,000 years ago to the population of the present day. At the centre of the exhibition is a genetic map of Britain – the first of its kind to be produced of anywhere in the world. But what exactly does this map show us and how was it created? Brian Mackenwells from the Wellcome Centre for Human Genetics explains…

While maps can be used to show us where we need to go, the one at the heart of the People of the British Isles study was used to show us where we’ve been. Researchers from the Wellcome Centre for Human Genetics wanted to reach back through time by looking at our genetic code.

We obviously can’t travel back a hundred years and sequence people’s DNA, so the next best thing is to sequence the genome of people whose grandparents were all from the same rural area. This is because people in rural areas at that time had a tendency not to travel very far, so the researchers guessed that the genes of their descendants would be like (slightly jumbled) snapshots of the genetic history of the area they were from.

This video, commissioned from Oxford Sparks especially for the exhibition, expands on this idea.

So the People of the British Isles researchers sequenced the DNA of just over 2,000 people and set to work analysing it all. The scientists looked for individuals with common genetic patterns and grouped them together. They had no idea where the individuals were actually from; the system just grouped people whose small genetic variations seemed to be the most similar to each other.

Here’s an example of the process. Imagine you were presented with a list of colours like these and asked to group them.

You would probably group them something like this:

There would be a ‘sort of red’ group, a ‘sort of green’ group, and a ‘sort of blue’ group. This is what the pattern-matching system was trying to do with genetic codes: make clusters of people who seemed to be similar to each other based on very small genetic variations.

But the really surprising bit came next. We took each individual in the study and plotted them on a map of Britain based on the location of their grandparents, using a symbol to denote which genetic cluster they had been placed in.

We weren’t sure what to expect. Would the symbols be spread out randomly over the map,  or would there be groupings? What might the groupings mean?

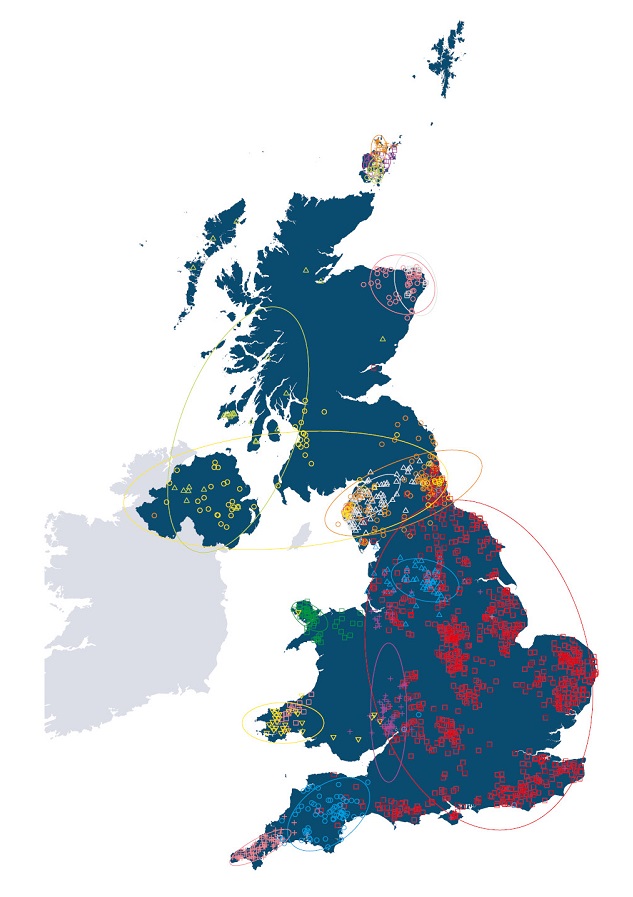
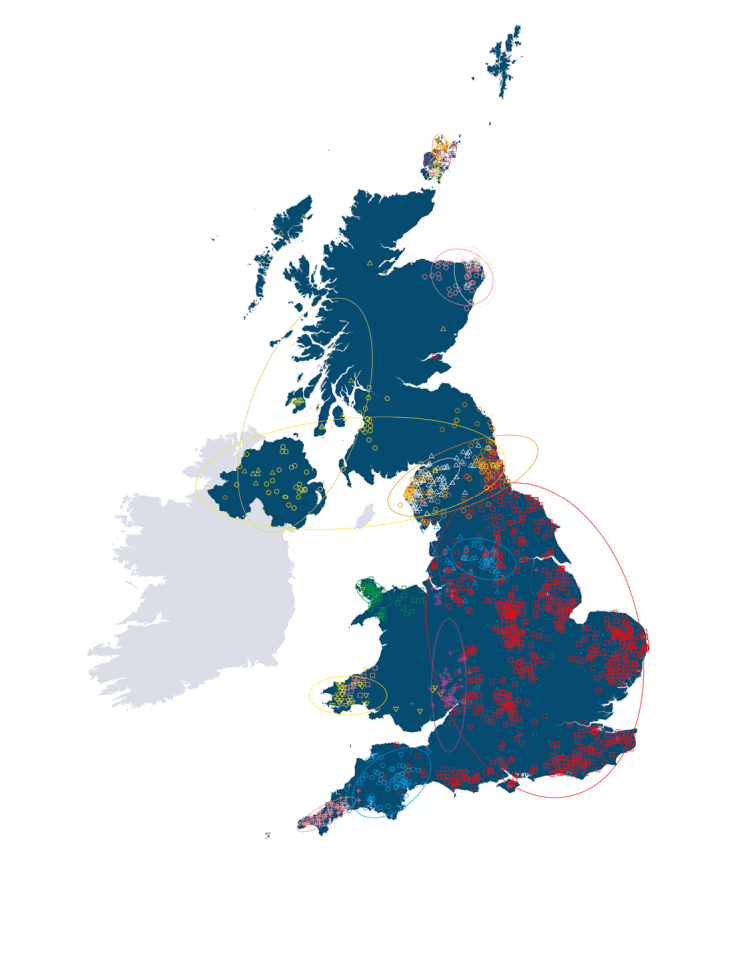
The result was striking: the genetic clusters are, for the most part, linked to quite specific geographical areas, as you can see in the final map here.

The People of the British Isles genetic map of Britain was the first map of its kind of anywhere in the world. Each marker represents a participant in the study, and the different symbols represented different genetic clusters. It’s clear that the genetic clusters are connected with geography.

What is this map revealing to us? When we compared these different groups to the unique genetic markers of different European populations, working with archaeologists and geographers, we were able to start to understand the meaning of the map. You can clearly see the genetic footprints left by historical migration and events from hundreds of years ago. The video below explains more about this.

The locations of many of the clusters correspond to regions controlled by known historical tribes and kingdoms. The map also shows how places like Northern Ireland and Western Scotland seem to share a genetic heritage.

You can learn more about the map, and the things we’ve learned from it, at the Settlers exhibition until the 16 September 2018.

Death, decay and fossilization

By Duncan Murdock, Research Fellow

Our oceans, rivers and lakes teem with life of all shapes and sizes, and have done so for hundreds of millions of years. We can get a glimpse of the wonderful diversity of life deep in the Earth’s past from fossils that can be found in the rocks beneath our feet. But the fossil record is as much a history of death as it is of life.

All animals die, in huge numbers every day, but the sea beds and forest floors of the Earth are not filling up with their remains. Decay is as inevitable as death. This is good news for those left behind, but bad news for fossil hunters.

Being preserved as a fossil is very much the exception, not the rule, and the chances of anything surviving the various processes by which the component parts of an animal are lost forever are vanishingly small, even for hard parts like shells, teeth and bones. For the ‘soft’ parts of animals, such as the muscles, eyes, guts and nerves, it is nearly impossible.

But ‘nearly impossible’ is good enough when you can consider every animal that ever lived, or more importantly, died. In exceptional circumstances ‘soft’ tissues do become fossils, and when they do they invariably give an unrivalled view of an otherwise completely lost world.

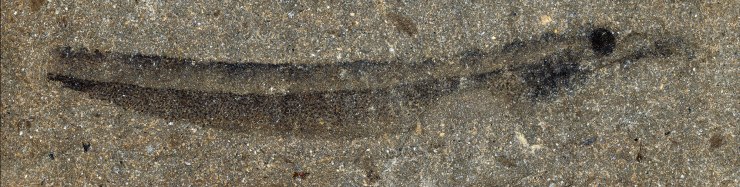
Although exceptionally well preserved, this fossil of a jawless fish is not entirely complete. Some features have been preserved, like the prominent dark eye spot and gill supports just beneath, but others, such as the guts and fins, have rotted away before they could be preserved. Image: Mark Purnell, Sarah Gabbott, Robert Sansom (University of Leicester)

We know from these exceptional fossils that the path from death to fossil is not random. Yes, you have to be lucky, but the odds are very much stacked towards certain combinations of who, what, where and when.

Furthermore, decay is not the whole story. Not only does anatomical information have to survive decay, it has to undergo parallel (but distinct) processes of preservation – conversion into materials that are stable over millions of years as part of a rock. It is the balance between the loss and retention of information that seals the fate of an organism’s remains.

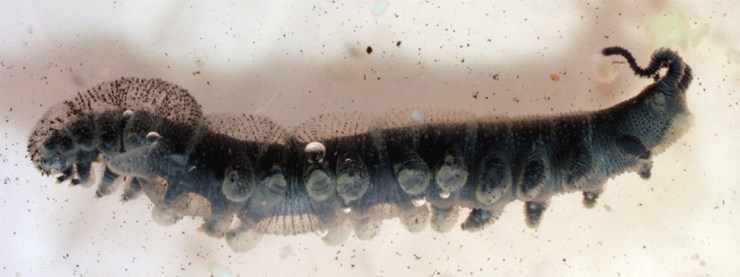
Three hundred million years ago, a small worm gulped its last breath and died. Its body began to rot and, were it not for the peculiar conditions of the sediments it was laid to rest in, would have been lost forever. Fortunately for us, what remained was preserved in rock – a rotten fossil. But how much rotted away before it was fossilized? By decaying modern relatives in the lab we can model this missing history, and build better-informed reconstructions of extinct animals. Image: Duncan Murdock

Left with only the lucky few, the parts of animals where retention exceeded loss, the fossil record is profoundly biased. One way to unravel this lost history of loss is it to conduct experiments, replicating decay and preservation. However, trying to make fossils in the lab, by contriving one particular set of conditions, is fiendishly complex – there are simply too many variables to set.

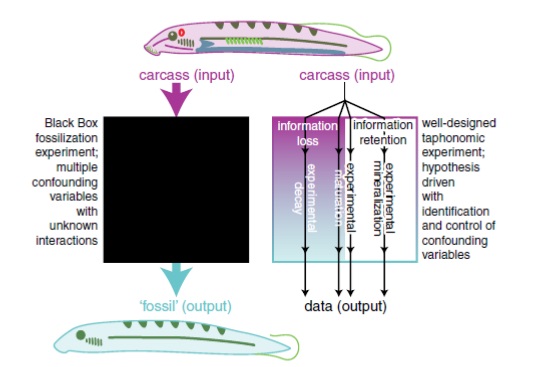
I have been working with researchers from the Universities of Leicester, Bristol, Manchester and University College Cork, and together we have described an alternative approach to unpack the ‘black box’ of fossilization and take each variable in turn, individually examining the different processes that result in retaining information as potential ‘fossils’ and, crucially, those that result in loss.

This cartoon illustrates the difference between experiments that attempt to replicate fossilization, treating the process as a black box, and the approach we are taking. The black box approach reveals little about the processes of information loss and information retention, the cumulative effects and interactions which ultimately results in a fossil (or, more often, not). Image: Purnell et al. 2018.

Ultimately this approach will allow more and more complex experiments to be designed, to unpick the interactions between the who, what, where and when in the lost history of death.

The techniques described here are published in Palaeontology today as ‘Experimental Analysis of Soft-Tissue Fossilization: Opening the Black Box‘, Purnell et al. 2018.

Spiders’ eyes cast in Diamond Light

by Imran Rahman, Deputy Head of Research

There are plenty of reasons to visit Didcot. The railway station is an important junction between Oxford and the west of England, the Didcot Railway Centre houses a great collection of trains, if you like that sort of thing, and Didcot Town Football Club are currently a respectable fourth* in Division One West of the Southern League…

But if that’s not enough to tempt you, Didcot is also home to the UK’s only synchrotron – a multi-million pound facility that goes by the name of Diamond Light Source. In February, six members of the Museum’s research team visited Diamond to carry out some important experiments on spiders.

But before we get to that, what exactly is a synchrotron light source? Well, it is a type of particle accelerator which uses huge magnets to speed up tiny particles, usually electrons, until they are moving almost as quickly as the speed of light. The particles are sent flying around a ring-shaped machine hundreds of metres across – the ‘doughnut’ structure in the photo.

The Diamond Light Source synchrotron in Didcot, Oxfordshire. Particles are accelerated to close to the speed of light around the ‘doughnut’ structure. Image: Courtesy of Diamond Light Source

This beam of high-energy particles gives off large amounts of ‘light’, or electromagnetic radiation, when its direction is changed. This radiation, usually in the form of X-rays, can be funnelled down to experimental stations, known as beamlines, and used for lots of different measurements and experiments. As the UK’s national synchrotron light source, Diamond is visited by scientists from all over the world every year.

So what does a museum want with a powerful X-ray beam? One of our research fellows, Lauren Sumner-Rooney, is particularly interested in studying the eyes and brains of spiders. So the team, led by Lauren, went to Didcot to create some X-ray images of spiders from the Museum’s collections.

Ready for your X-ray close -up? A spider specimen is mounted in the I13-2 beamline at Diamond Light Source. Image: Lauren Sumner-Rooney

You may not have looked too closely at a spider’s head before, but they usually have eight eyes as well as eight legs. That said, there is actually quite a lot of variation in the number and structure of eyes between different species, and Lauren is interested in documenting this variation across selected spider families to investigate how it affects spiders’ brain structures.

Using the I13-2 beamline at Diamond, and fighting severe sleep deprivation with the aid of strategically-selected songs and snacks, the team was able to visualize details measuring less than one thousandth of a millimetre without damaging the precious specimens. They were assisted by Andrew Bodey, a senior support scientist at Diamond, and Emelie Brodrick, a PhD student at the University of Bristol.

The research team following 72 hours of very little sleep! From left to right: Ricardo Pérez-de la Fuente, Lauren Sumner-Rooney, Imran Rahman, Jack Matthews and Emelie Brodrick. Image: Emelie Brodrick

Over the course of 72 straight hours, the team scanned 116 spiders, creating about 14 terabytes of data. This will form the basis of a variety of exciting scientific research projects at the Museum over the coming years. Watch this space for the results!

*Didcot Town were fourth in the Southern League Division One West table on 8th March. The Museum accepts no responsibility for any change in their position after this date.

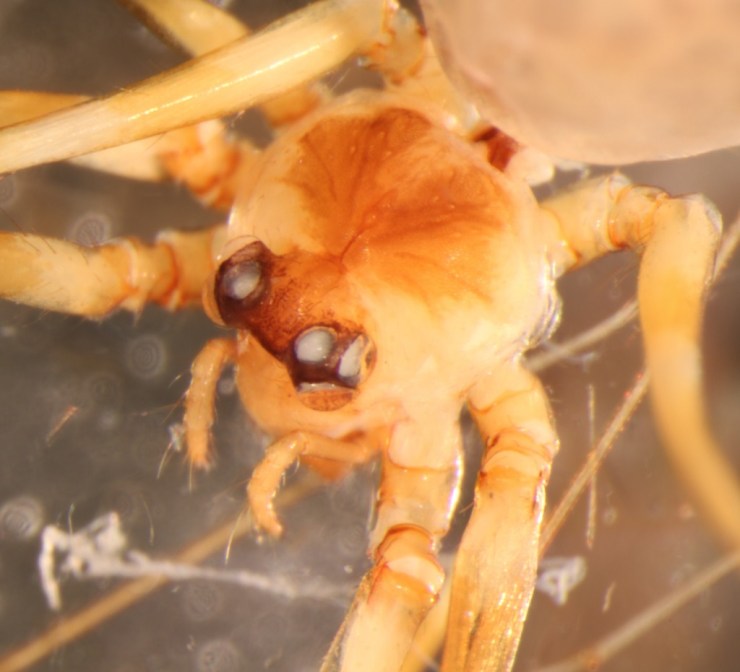
Top image of Pholcus moca courtesy of Smithsonian Institution.

Carnivore conservation

A new choose-your-own-adventure board game created by researchers from the University of Oxford’s Department of Zoology puts players centre-stage in a global carnivore conservation challenge. The educational game is launching a Kickstarter fundraising campaign today and here co-designer Dr Cedric Tan tells us all about it…

Have you ever wondered what it’s like being a conservation biologist? We have spent the past year creating and testing a brand new board game – The WildCRU Game: Global Carnivore Conservation – that reveals some of the challenges faced by conservationists, the animals themselves, and the indigenous people who live with them. We’re now looking to get the game out to schools and communities all across the world with a £40,000 Kickstarter funding campaign featuring lots of rewards and discounts for our backers.

The game has been co-designed by Jennifer Spencer and myself to appeal to non-scientists and people of different ages. Players work together cooperatively as WildCRU researchers to gather the resources to complete carnivore conservation projects across the globe.

Stories in the game are taken directly from the real experiences of the WildCRU team. Players must decide what to do in choose-your-own-adventure-style encounters to gather the equipment, personnel, and transport resources they need for their projects.

In developing this game, we chose six varied WildCRU projects including the Hwange Lion Research project, based in Zimbabwe, and the famous water vole study in the UK, to show players the breadth of WildCRU’s research.
– Co-designer Jennifer Spencer, WildCRU

Multiple choice research questions are also based on real WildCRU research; they reveal more about the environment of each project – the flora, herbivores, competitor carnivores, and study species of the study sites. With the additional pressure of Global Events, players will learn about how difficult wildlife conservation projects can be.

It has been great to see that the game appeals to both kids and adults. People have found it to be an immersive experience in which players experience the challenges of real people, real situations and real research. We also hope that the game will provide local families with the opportunity to learn about the wildlife around them, and how to live in harmony alongside it.

Through the game and our other education efforts we’re hoping to increase environmental awareness and to introduce a wide variety of people to the science and processes behind real-world conservation.

Images and video: Laurie Hedges (lauriehedges.com)

Movers and settlers

Our new exhibition Settlers, which opens today, shows that the history of the people of Britain is one of movement, migration and settlement. Here, exhibition writer Georgina Ferry finds that Britain has been receiving new arrivals since the last Ice Age.  

In Britain following the Brexit vote, the word ‘migration’ has taken on an emotional and political charge. A new exhibition opening today takes a long-view of the movement of people, looking in particular at how migration has formed the British population.

Settlers: genetics, geography and the peopling of Britain tells the story of the occupation of Britain since the end of the last Ice Age, about 11,600 years ago. From this perspective, today’s pattern of movement into and out of the country is only the latest in a long history of alternating change and stability that has made the people of Britain who they are today.

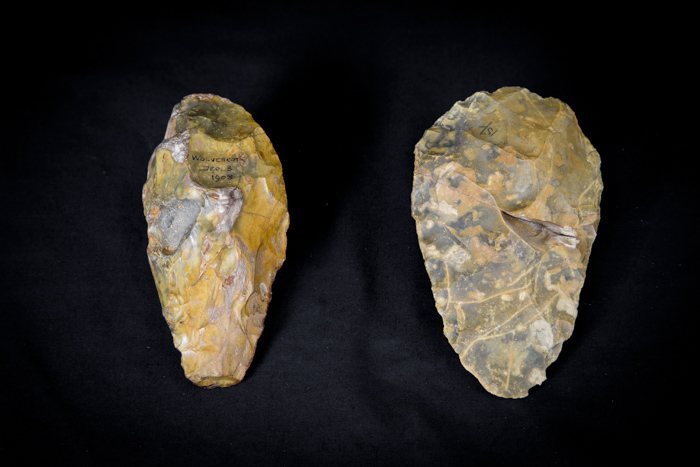
Hand axes from Wolvercote, Oxford
About 340,000 – 300,000 years ago, when conditions were slightly warmer than at present, Neanderthal hunters lived alongside a channel of the Thames near Oxford where the village of Wolvercote now stands. They made flint hand axes – all-purpose butchering, digging and chopping tools. They hunted animals now extinct in Britain.

Tracing these movements has been a fascinating detective story, with clues coming from many different types of evidence. The starting point for Settlers is a remarkable study carried out by Oxford scientists, who used DNA samples from contemporary British volunteers to trace the origins of the people who settled Britain between the end of the Ice Age and the Norman Conquest of 1066. One striking finding is that the bonds that unite Celtic communities in Cornwall, Wales and Scotland are largely cultural – genetically these groups are quite distinct.

Drinking horn finial of copper alloy and glass, 9th century – Northern Ireland. The Ashmolean Museum, University of Oxford

The genetic evidence adds a new dimension to the archaeological story, based on artefacts left behind by our ancestors, or other historical signposts such as place names. For example, although occupying Roman armies left us the names of their forts and cities, they don’t seem to have left much of their DNA. They came, saw and conquered, but didn’t stay in large enough numbers to make a genetic impact on the native British population. In contrast the Anglo-Saxons, who arrived after the Romans withdrew, left a strong genetic signature everywhere except Wales and the Scottish Highlands.

It took 2,000 volunteers and software that can distinguish tiny differences to arrive at the various regional clusters that came out of the study. When you visit the exhibition, you can play a fascinating interactive lottery game to see just how unlikely it is that genes from any specific ancestor of more than a few generations will still be in your DNA.

This map, created by the People of the British Isles study, is the result of comparing patterns in the DNA of a carefully selected sample of around 2,000 modern British people. It provides new evidence about links between genetic ancestry and geographical origins.

The story of movement and settlement doesn’t stop in 1066. Researchers in Oxford’s School of Geography have plotted census data since 1841 against global events, from the persecution of Russian Jews to the enlargement of the European Union, to illustrate the ebb and flow of people from and to Britain that has produced the current population mix. Another interactive lets you compare your own family’s journey with those of all the other visitors.

We will have to wait until the census of 2021 to know what a difference Brexit will make, but we can be sure that people will be arriving and leaving for a lot longer than that.

www.oum.ox.ac.uk/settlers