Great tits living in urban areas fight off more infections than their rural cousins. Image Credit - CC BY-SA 4.0

Bird immune systems reveal harshness of city life

Very little is known about how the social behaviours of house sparrows are changing in urban habitats. Image Credit - Flickr/B Balaji, CC BY-NC 2.0

This article is taken from European research magazine Horizon as part of our partnership to share natural environment science stories with readers of More than a Dodo.

Researchers have found that many internal defence mechanisms that are quiet in rural birds are much more active in those in cities. These biological pathways are pumping out extra antioxidants, immune system cells and detoxifiers – a sign that urban life is challenging their health.

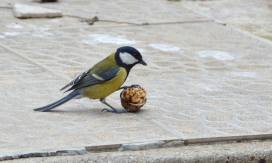
Globally, bird numbers are dropping. According to figures published by conservation organisation BirdLife International last year, 40% of bird species have declining populations while 7% are increasing in number. BirdLife cites urbanisation as a force destructive to many bird species, but a few do well in cities, such as the adaptable great tit, whose population is on the rise.

City wildlife have a different experience of predators, food availability and diseases than those in the country. This may be helpful to them – for example, humans leave food out for birds in their gardens. But they also have to cope with a fragmented habitat and with noise, air and light pollution. Scientists want to understand these forces in order to get a better grasp of the dramatic drop in some bird populations.

A research group in Sweden has been studying great tits living in 500 nestboxes in the city of Malmö, and a similar number in the forest. Great tits were chosen partly because they are well-studied and also because their use of nestboxes makes it easy for researchers to locate and examine them. The researchers check the boxes weekly during spring, weighing chicks with tiny balances, measuring them with adapted rulers, and tapping them for blood, according to Dr Hannah Watson, an ecologist at Lund University in Sweden.

An early study revealed that the urban birds had higher levels of antioxidants circulating in their blood than rural birds – a defence mechanism against attack from free radicals – toxic versions of oxygen atoms.

‘Exposure to air pollution would generate more free radicals (in the body) which can then increase what’s called oxidative stress – a kind of cellular level stress,’ said Dr Watson. ‘The free radicals cause damage to DNA, lipids, proteins – all the macromolecules in the cell.’

Switched on
To explore the consequences in more detail, she compared RNA (a counterpart to DNA) samples between the two populations, in a project called URBAN EPIGENETICS.

While genes code for the structure and maintenance of a living thing, they only function if they are switched on – or expressed. This happens via a bit of chemistry, methylation, which can be triggered by environmental factors.

Dr Watson found that genes responsible for the city birds’ immune responses had been upregulated, implying that they were fighting off more infections than rural birds. Similarly, other genes, such as those for neutralising poisons, for inflammation and for antioxidant production to combat free radicals, were also switched on.

‘It’s only the birds of really good quality that are able to actually survive the nestling period in the city.’
Dr Hannah Watson, Lund University, Sweden

‘We showed big differences in terms of the genes that are expressed and the levels they are expressed at,’ she said. ‘We interpret this as being consistent with our prediction that birds living in the city are exposed to more of these environmental stressors.’

But this doesn’t necessarily mean that urban birds are suffering, says Dr Watson. ‘It could just indicate that they’re able to respond and cope.’

To understand whether the birds were taking urban stress in their stride, Dr Watson joined a study led by one of her colleagues in which they measured the caps – telomeres – at the ends of the birds’ chromosomes.

Over the last decade, scientists have shown that telomeres gradually shorten each time a cell divides, and also in response to other stressors, eventually reaching a stage of senescence, or deterioration, which corresponds to an organism’s old age and death. In fact, the length of a creature’s telomeres, it turns out, seems to foretell its lifespan. The team conjectured that, if the urban stresses were actually affecting the great tits’ ability to survive, this would be revealed in the lengths of their telomeres.

They found that city chicks that were ready to fledge had on average shorter telomeres than those of fledgling forest chicks.

Great tits living in urban areas fight off more infections than their rural cousins. Image Credit - CC BY-SA 4.0
Great tits living in urban areas fight off more infections than their rural cousins. Image Credit – CC BY-SA 4.0

Weeded out
Those with the shortest telomeres were less able to cope with urban stresses and died before reaching adulthood. Paradoxically, that meant that adult great tits in the city were likely to be stronger than the average forest adult because the weaker ones had been weeded out.

‘It’s only the birds of really good quality that are able to actually survive the nestling period in the city,’ said Dr Watson.’ In fact, the researchers think that while multiple stressors in the city are wiping out younger, weaker birds, they may not be of much consequence during adult life for those tough enough to make it that far.

Urban living may also mean that the social structures that served a species well in the natural habitat have become no longer necessary or even harmful.

House sparrows in the wild, for example, compete with each other for food according to a dominance hierarchy that is determined largely by size. But in cities, there are two key differences – food is more abundant and house sparrows are smaller, possibly because they don’t need to store body fat since winters are milder. Either factor could undermine the way they normally compete for food.

Likewise, house sparrows are known for the way they cooperate to mob potential predators. But when the danger shifts from a bird of prey to a cat or dog, this behaviour could become redundant.

With their numbers in decline, but still strong at as many as 1.3 billion globally, their toughness, aggression and ability to survive around humans suggests they seem to do well in urban areas.

Dr Lyanne Brouwer, an animal ecologist at Radboud University Nijmegen in the Netherlands, is studying house sparrows in a variety of urban habitats as they engage in their cooperative and competitive behaviours in a project called UrbanBird, which runs until 2020. She is using observations gathered by ordinary people, as well as her own field work to understand the causes and longterm effects of any behavioural change in the way house sparrows interact with each other. Ultimately this could help predict how urbanisation could affect other species and biodiversity.

‘It’s really interesting to see that all the factors that could affect social behaviour, like for example food availability or the predators that are around, are all very different in cities – so how would that affect these social behaviours? It turns out there is basically nothing known about how such behaviours change in cities,’ she said.

The research in this article was funded by the EU.

This post Bird immune systems reveal harshness of city life was originally published on Horizon: the EU Research & Innovation magazine | European Commission.

The genetic lottery: self-destruction or survival?

Illustrated strand of DNA

As one of the many scientists who contributed to our Settlers exhibition, geneticist Dr Calliope Dendrou from the Wellcome Centre for Human Genetics ran a Spotlight talk as part of the exhibition’s event programme, where she explained more about her research into genetics and autoimmune diseases…

Our genes make us who we are – they are what unite us a single species, Homo sapiens – but they are also what make us unique individuals, with a particular set of characteristics. Genes are made up of DNA inherited from one individual to the next, transmitting the code for life through time.

The DNA ‘alphabet’ comprises four letters, A, C, G and T, and three billion of these letters make up the complete human genome. Comparing two unrelated individuals, on average around one in 1,000 of the three billion letters will differ. Genetically speaking, each of us is 99.9 percent the same as every other unrelated person.

Studying our genetic composition and the similarities and differences between individuals is of interest from a historical, geographic and sociological perspective, as the Settlers exhibition at the Museum shows. But it can also have medical implications for our understanding of the types of diseases we are susceptible to.

1024px-Neutrophil_with_anthrax_copy
Immune cell (yellow) engulfing anthrax bacteria (orange). Image: Volker Brinkmann [CC BY 2.5], via Wikimedia Commons
My lab works on the genetics of autoimmune diseases, which affect some ten percent of people worldwide and include relatively common conditions such as rheumatoid arthritis, multiple sclerosis, and type 1 diabetes.

Autoimmune diseases arise when the cells of the immune system function inappropriately. The immune system is made up of millions of immune cells patrolling the body, sensing their environment and sending signals to each other.

If the body has been injured due to physical trauma or an infection, then upon receiving the right signals immune cells help to clear damaged cells or fight off pathogens. But sometimes immune cells can begin to respond to the wrong signals, triggering a self-destruction. When this happens they can destroy the body’s own tissues and organs and then autoimmune start to diseases develop.

Auto immune illustration
Autoimmune disorders in a nutshell –  illustration by Beatrice the Biologist

The common autoimmune diseases are very complex and are thought to result from a combination of genetic and environmental influences. Hundreds of genetic factors can influence someone’s risk of autoimmune disease development, so having a low or high risk is a genetic lottery – it depends on how many different genetic factors happened to have come together for that person.

We are investigating the biological consequences of these genetic factors to find better ways to target the immune cells that are attacking the body. The trick is to do this without suppressing the immune system’s ability to fight off infection, a problem associated with drugs used treat autoimmune disease patients today.

A genetic map of Britain

Our Settlers exhibition tells the story of the peopling of Britain, from the arrival of the earliest modern humans over 40,000 years ago to the population of the present day. At the centre of the exhibition is a genetic map of Britain – the first of its kind to be produced of anywhere in the world. But what exactly does this map show us and how was it created? Brian Mackenwells from the Wellcome Centre for Human Genetics explains…

While maps can be used to show us where we need to go, the one at the heart of the People of the British Isles study was used to show us where we’ve been. Researchers from the Wellcome Centre for Human Genetics wanted to reach back through time by looking at our genetic code.

We obviously can’t travel back a hundred years and sequence people’s DNA, so the next best thing is to sequence the genome of people whose grandparents were all from the same rural area. This is because people in rural areas at that time had a tendency not to travel very far, so the researchers guessed that the genes of their descendants would be like (slightly jumbled) snapshots of the genetic history of the area they were from.

This video, commissioned from Oxford Sparks especially for the exhibition, expands on this idea.

So the People of the British Isles researchers sequenced the DNA of just over 2,000 people and set to work analysing it all. The scientists looked for individuals with common genetic patterns and grouped them together. They had no idea where the individuals were actually from; the system just grouped people whose small genetic variations seemed to be the most similar to each other.

Here’s an example of the process. Imagine you were presented with a list of colours like these and asked to group them.

You would probably group them something like this:

There would be a ‘sort of red’ group, a ‘sort of green’ group, and a ‘sort of blue’ group. This is what the pattern-matching system was trying to do with genetic codes: make clusters of people who seemed to be similar to each other based on very small genetic variations.

But the really surprising bit came next. We took each individual in the study and plotted them on a map of Britain based on the location of their grandparents, using a symbol to denote which genetic cluster they had been placed in.

We weren’t sure what to expect. Would the symbols be spread out randomly over the map,  or would there be groupings? What might the groupings mean?

The result was striking: the genetic clusters are, for the most part, linked to quite specific geographical areas, as you can see in the final map here.

The People of the British Isles genetic map of Britain was the first map of its kind of anywhere in the world. Each marker represents a participant in the study, and the different symbols represented different genetic clusters. It’s clear that the genetic clusters are connected with geography.

What is this map revealing to us? When we compared these different groups to the unique genetic markers of different European populations, working with archaeologists and geographers, we were able to start to understand the meaning of the map. You can clearly see the genetic footprints left by historical migration and events from hundreds of years ago. The video below explains more about this.

The locations of many of the clusters correspond to regions controlled by known historical tribes and kingdoms. The map also shows how places like Northern Ireland and Western Scotland seem to share a genetic heritage.

You can learn more about the map, and the things we’ve learned from it, at the Settlers exhibition until the 16 September 2018.

Where Do We Come From? What Are We? Where Are We Going?


These are some of the big questions asked in our current special exhibition, Settlers. It’s also the title of a new artwork by Ian Kirkpatrick that has just been commissioned by the Museum.

You may remember, back in July we put out a call for artists to respond to the main themes of the upcoming Settlers exhibition. We received an incredible response, with almost 100 proposals, so needless to say we were spoilt for choice! After several rounds of shortlisting, discussion and deliberation, we chose Ian Kirkpatrick, a Canadian artist now based in York.

Lit up for the Settlers exhibition launch.
Credit: Ian Kirkpatrick

We were excited by Ian’s bold iconography and references to the history of art and design, while using shapes and colours usually seen on contemporary street signage. His approach to the themes and issues around migration, genetics and settlement were innovative and brave. We also couldn’t wait to see how his work would look in our Victorian neo-Gothic building.

Ian working in his studio. Credit: Ian Kirkpatrick

Over a period of four months, Ian researched, planned and created his spectacular final piece Where Do We Come From? What Are We? Where Are We Going? Here he explains a little about his artistic process:


Most of my projects begin with a period of research – often looking at historical events or interesting facts related to the brief. I often sketch out a very rough layout of the design in my notebook, then create the actual artwork directly onto the iPad or computer. Because I use vector-based software, I can easily rearrange or modify graphics – so the design is constantly shifting until the artwork is finished.

Ian Kirkpatrick’s final design. The two smaller panels (L and R) can be seen on display in the Settlers exhibition gallery.

Ian created a series of six panels that explores the social and natural causes behind human migration, both in ancient times and in the present day. It presents historical and modern peoples moving across a landscape in response to conflict, climate change and urbanisation, and remixes imagery from classical paintings alongside iconography from Great War postcards, Roman coins and the Bayeux Tapestry.

Ian, Peter Johnson and Adam Fisk installing the main panels of the artwork.

Of course, in a building like ours, the installation of such a large, bold piece of work would never be easy. Peter Johnson, the Museum’s Building Manager, came up with an ingenious solution to hold the panels into the arches, without damaging the masonry by drilling or glueing.

Pieces prepared in the workshop, to sit on the capitals and support the artwork

Hand-cut pieces of plywood were made to snugly fit round the capitals, so that the Dibond aluminium sheets don’t rest on the stone.

Credit: Ian Kirkpatrick

So, standing back and looking at the finished piece, looking resplendent in the winter sunshine and attracting the attention of hundreds of museum visitors, how does Ian feel?

The project was a lot of work – but it’s also been very satisfying to see it finally installed. Although the piece initially started as a comment on contemporary British settlement, it evolved into something that explored global migration throughout all of history.  Trying to find a way to tackle a theme that big, while still remaining visually coherent, is quite tricky!  But I was really pleased with the results and love seeing the finished piece housed within the magnificent neo-Gothic architecture of the Museum!


Movers and settlers

Our new exhibition Settlers, which opens today, shows that the history of the people of Britain is one of movement, migration and settlement. Here, exhibition writer Georgina Ferry finds that Britain has been receiving new arrivals since the last Ice Age.  

In Britain following the Brexit vote, the word ‘migration’ has taken on an emotional and political charge. A new exhibition opening today takes a long-view of the movement of people, looking in particular at how migration has formed the British population.

Settlers: genetics, geography and the peopling of Britain tells the story of the occupation of Britain since the end of the last Ice Age, about 11,600 years ago. From this perspective, today’s pattern of movement into and out of the country is only the latest in a long history of alternating change and stability that has made the people of Britain who they are today.

Hand axes from Wolvercote, Oxford
About 340,000 – 300,000 years ago, when conditions were slightly warmer than at present, Neanderthal hunters lived alongside a channel of the Thames near Oxford where the village of Wolvercote now stands. They made flint hand axes – all-purpose butchering, digging and chopping tools. They hunted animals now extinct in Britain.

Tracing these movements has been a fascinating detective story, with clues coming from many different types of evidence. The starting point for Settlers is a remarkable study carried out by Oxford scientists, who used DNA samples from contemporary British volunteers to trace the origins of the people who settled Britain between the end of the Ice Age and the Norman Conquest of 1066. One striking finding is that the bonds that unite Celtic communities in Cornwall, Wales and Scotland are largely cultural – genetically these groups are quite distinct.

Drinking horn finial of copper alloy and glass, 9th century – Northern Ireland. The Ashmolean Museum, University of Oxford

The genetic evidence adds a new dimension to the archaeological story, based on artefacts left behind by our ancestors, or other historical signposts such as place names. For example, although occupying Roman armies left us the names of their forts and cities, they don’t seem to have left much of their DNA. They came, saw and conquered, but didn’t stay in large enough numbers to make a genetic impact on the native British population. In contrast the Anglo-Saxons, who arrived after the Romans withdrew, left a strong genetic signature everywhere except Wales and the Scottish Highlands.

It took 2,000 volunteers and software that can distinguish tiny differences to arrive at the various regional clusters that came out of the study. When you visit the exhibition, you can play a fascinating interactive lottery game to see just how unlikely it is that genes from any specific ancestor of more than a few generations will still be in your DNA.

This map, created by the People of the British Isles study, is the result of comparing patterns in the DNA of a carefully selected sample of around 2,000 modern British people. It provides new evidence about links between genetic ancestry and geographical origins.

The story of movement and settlement doesn’t stop in 1066. Researchers in Oxford’s School of Geography have plotted census data since 1841 against global events, from the persecution of Russian Jews to the enlargement of the European Union, to illustrate the ebb and flow of people from and to Britain that has produced the current population mix. Another interactive lets you compare your own family’s journey with those of all the other visitors.

We will have to wait until the census of 2021 to know what a difference Brexit will make, but we can be sure that people will be arriving and leaving for a lot longer than that.

www.oum.ox.ac.uk/settlers